
One of the most appealing investments across industries, commercial units, and renewable energy developers is a 1 MW solar power plant. As electricity costs in India continue to rise, sustainability requirements tighten, and industries increasingly source green power, MW-scale solar has become a preferred long-term energy solution.
The timing is also ideal. Solar module prices have fallen significantly in recent years, and technologies such as TOPCon and bifacial modules have pushed efficiency to new levels. States are easing open-access regulations, enabling industries to purchase or produce solar energy at predictable costs over long-term periods of 15-25 years. Renewable development in India continues growing at a high rate, supported by policies such as ALMM, PLI-favoured domestic production, and enhanced grid infrastructure.
Due to these changes, a 1 MW solar plant now offers a shorter payback period, higher production, and more predictable income. This is why it is widely adopted by factories, warehouses, industrial parks, commercial complexes, institutions, and renewable developers.
What is a 1 MW Solar Power Plant
A 1 MW (1,000 kW) solar power plant is a large-scale installation capable of producing clean energy for factory consumption, commercial use, or grid sale.
Key Performance Metrics
Parameter | Value |
Daily generation | 4,000-4,500 units (kWh) |
Monthly generation | 1.2-1.35 lakh units |
Annual production | 14-16 lakh units (kWh) |
Ground-mount land | 4-5 acres (shadow-free) |
Rooftop space | 80,000-1,10,000 sq. ft. |
Due to its size, a 1 MW plant enables businesses to achieve substantial savings on grid power and diesel usage, with energy costs typically 40-60% lower than traditional grid tariffs.
Common Deployments
- Mass production (textile, pharma, ceramics, steel, food processing)
- Shopping malls and IT zones
- Institutions and universities
- Power generators under PPAs
Who Should Invest in a 1 MW Solar Plant
A 1 MW solar plant is best suited for individuals and organizations looking for long-term, stable, and sustainable returns. Ideal investors include:
- Industrial and manufacturing units: Businesses with high electricity consumption can significantly cut power costs and protect themselves from rising grid tariffs through captive solar generation.
- Commercial enterprises: Malls, IT parks, warehouses, hospitals, and large campuses benefit from predictable energy expenses and improved sustainability credentials.
- Independent Power Producers (IPPs): Investors seeking steady, long-term income through power purchase agreements (PPAs) with utilities or private buyers.
- Infrastructure and institutional investors: Those interested in low-risk, asset-backed projects with consistent cash flows over 20-25 years.
- Landowners and high-net-worth individuals (HNIs): Owners of suitable land looking to monetize it through clean energy projects.
- Businesses focused on sustainability goals: Companies aiming to reduce carbon footprint and meet ESG or net-zero commitments.
In short, a 1 MW solar plant is ideal for investors who have a long-term vision, access to land or capital, and a need for reliable, cost-effective, and clean power.
Types of 1 MW Solar Power Plants
The main types of 1 MW solar power plants include:
1. On-Grid (Most Common)
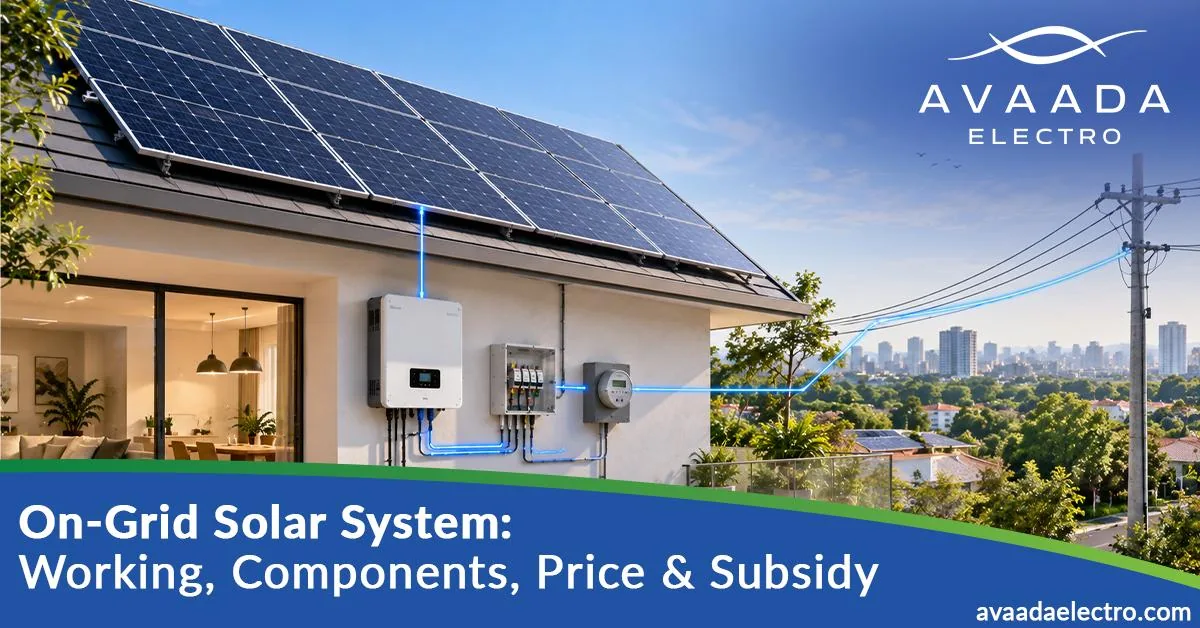
The most popular model, directly linked to the grid without battery storage. Power flows from panels to inverter to grid, offsetting consumed electricity.
Best for high-daytime load industries, commercial properties, EPC developers, and open-access consumers.
Key advantages include low capital cost and maximum return on investment.
2. Off-Grid (Battery-Based)
Uncommon at MW scale due to high battery costs. Best for very rural locations without grid access.
3. Hybrid System (Solar + Battery + DG Sync)
Provides on-grid production with battery backup and diesel generator synchronization for critical loads. Demand is increasing, driven by:
- Data centres
- Manufacturing units with critical loads
- Business centres where power is essential
Why choose hybrid?
Maintains stability, accommodates peak loads, optimizes power consumption despite intermittent grid supply, and ensures zero downtime through DG sync.
1 Megawatt Solar Power Plant Cost in India
The cost depends on technology, location, components, and plant type.
Type of 1 MW Solar Plant | Approximate Cost |
Standard Mono-PERC | ₹3.8-4.2 crore |
N-Type TOPCon (higher efficiency) | ₹4.3-₹4.7 crore |
Hybrid Plant (Battery + DG Sync) | ₹5.5-₹7 crore |
Region-Wise Labour Variation
North and East India typically have slightly higher labour costs, while West and South India offer more competitive EPC rates.
State-Wise 1 Megawatt Solar Power Plant Cost in India
State | Approx. 1 MW Cost | Key Advantages |
Rajasthan | ₹3.8-4.2 crore | Highest irradiance, lowest land cost |
Gujarat | ₹4.0-4.5 crore | Best policy support, port access for exports |
Maharashtra | ₹4.2-4.8 crore | Strong industrial demand, open access ease |
Karnataka | ₹4.1-4.6 crore | Good irradiance, competitive EPC rates |
Haryana | ₹4.0-4.5 crore | PM Surya Ghar scheme, HAREDA support |
Tamil Nadu | ₹4.2-4.7 crore | Stable generation, manufacturing hub |
Uttar Pradesh | ₹4.0-4.5 crore | Large land banks, growing industrial base |
What is the Power Output of a 1 MW Solar System
A 1 MW solar power plant in India produces 4,000-4,500 units of electricity per day, depending on location, module technology, inverter quality, and seasonal variation. In one year, this will be approximately 14-16 lakh units of clean electricity.
Calculation Method
- Installed capacity: 1 MW = 1,000 kW
- Energy generation (kWh) = Capacity (kW) × Peak sun hours × Performance factor
- Typical performance factor: 0.75-0.90 (commonly 0.80, accounting for inverter, temperature, dust, wiring, and shading losses)
Average Peak Sun Hours in India
Region | Peak Sun Hours |
High irradiance (Rajasthan, Gujarat) | 5.5-6.5 |
Good solar zones (Maharashtra, Telangana, MP) | 5.0-5.5 |
Moderate zones (Punjab, Haryana, UP) | 4.5-5.0 |
Lower zones (Kerala, NE India, Coastal Karnataka) | 3.5-4.5 |
Estimated Power Generation
Parameter | Generation |
Daily generation | 4,000-4,800 units |
Monthly generation | 1.2-1.4 lakh units |
Annual generation | 14.4-17.3 lakh units |
Stronger solar irradiation in regions such as Rajasthan, Gujarat, Karnataka, and Uttar Pradesh results in high generation, whereas states with longer monsoons, such as Kerala, Karnataka (coastal), and Northeast India, can generate a little less.
The large output in 1 MW plants within a year makes it attractive to industries with massive activities during the day, business premises, and captive or open-access solar developers.
Land Required For 1 MW Solar Plant (Rooftop vs Ground-Mount)
The size of land required for 1 mw solar plant be determined by the layout and technology:
Ground-Mounted Plants
The average ground-mounted 1 MW plant will need 2.4 – 3 acres of shadow-free land.
A 1 MW capacity can be achieved with fewer panels using high-efficiency N-type TOPCon modules, which can reduce land requirements by approximately 10-12%.
Panel Density Impact
With 625 Wp+ modules and modern high-density mounting, a 1 MW ground-mount plant fits in 2.4 – 3 acres instead of the older 4-5 acre benchmark.
Rooftop MW-Scale Systems
On large roofs (factories, warehouses, malls) in industries and commercial buildings, a maximum of 1 MW can be installed:
- 80,000-1,10,000 sq. ft. of rooftop space
- Relies on structural strength and panel wattage
- Solar adds 15-20 kg/m² dead load requires structural consultant clearance
Rooftop MW plants eliminate land acquisition costs and are more favored in highly populated industrial belts.
Installation Timeline and Project Phases
The actual installation of a 1 MW solar power plant in India requires 120-180 days (approximately 4-6 months).
Phase | Duration | Activities |
Planning and Approvals | 30-60 days | Site survey, land acquisition/lease, design, legal approvals |
Construction & Installation | 45-60 days | Civil works, structure erection, module mounting, inverter commissioning, electrical work |
Testing and Commissioning | 10-15 days | System testing, synchronization, final inspections |
Total Project Execution | 120-180 days | Relatively fast infrastructure investment |
Approvals & Permissions Required (State-Wise Overview)
A 1 MW solar project will require a number of technical and regulatory approvals. The processes vary by state, but the major requirements are similar:
Key Approvals
- CEIG/CEA Safety Approval
- Net-Metering/Gross Metering/Open Access Permission.
- Approval of DISCOM connectivity.
- Permission for grid synchronization.
- Evacuation line (where applicable), Right of Way (RoW).
- Environmental clearance (only for some large-scale layouts)
Which states are faster in solar policy approvals?
States that have the most simplified solar policies:
- Gujarat
- Rajasthan
- Maharashtra
- Karnataka
These areas consist of dedicated RE nodal agencies, accelerated CEIG clearance, and robust grid infrastructure, which make them favorable in terms of MW-scale projects.
Estimated Expected Savings and Profitability
Depending on the model (captive, group captive, open access, third-party sale), a 1 MW solar plant can save a considerable amount of money by lowering power bills.
Industrial Captive Use
Industries that purchase grid power at ₹7-10/unit would be able to reduce the cost to ₹2.5-3.5/unit, which would save:
- ₹1.2-1.6 crore per year
- Payback in 4-5.5 years
- 25-year lifetime savings: ₹25-35 crore
Selling Power Under Open Access
At a price of ₹4.5-6/unit, the plant will be able to produce:
- ₹6.5-9.6 lakh per month
- Increased margins in states that are favourable on charges
Green Benefits (Enterprises and ESG)
1 MW solar offsets about:
- 1,200-1,500 tonnes of CO₂ per year
- Equivalent to planting 55,000-70,000 trees annually
This is used by many corporations in sustainability reporting and green certification.
Overview of Return on Investment (ROI) & Payback Period
Solar is now one of the most stable and predictable long-term investments in India.
Scenario | Payback Period | 25-Year ROI | IRR |
Captive Industrial Use | 4-5.5 years | 700-900% | 14-20% |
Third-Party/Open Access Sale | 5-7 years | 550-750% | 11-16% |
Hybrid & Battery Systems | 7-9 years | 450-600% | 10-14% |
1 mw Solar Power Plant Subsidy & Policy Support
Although the government does not offer subsidies on large-scale commercial plants, it has a number of indirect financial incentives that shorten the payback period of a 1 MW project.
Does a 1 MW plant get a subsidy?
No, MNRE central subsidies are applicable to residential rooftops only.
Solar projects which are commercial and industrial are unsubsidized in terms of capital.
However, this is what improves project economics:
Accelerated Depreciation (AD)
- Accelerated depreciation of up to 40% in the first year. This alone improves ROI by 8-12%.
GST Input Credit
- Purchases of modules and inverters are subject to GST, which can be claimed as ITC by businesses.
Open Access Solar Policies
- States such as Gujarat, Rajasthan, Maharashtra, Coastal Karnataka, and MP have favourable open access policies that allow purchase of solar power at cheaper rates.
Waivers and concessions (State-specific)
- Some states offer wheeling charge waivers, concessions on transmission charges, and banking of surplus energy.
LTA / GNA Reforms
- Grid integration becomes simpler and quicker for new developers through the General Network Access system.
Takeaway
A 1 MW solar plant is among the best ROI clean energy projects even without subsidy, primarily because of accelerated depreciation, reduced solar tariffs, and robust open-access reforms.
Power Generation of 1 MW Solar Plant (Daily, Monthly, and Yearly Production)
The output of a 1 MW solar facility depends on the area, panel type, design, and solar irradiation quality. However, in Indian climatic conditions, the figures are consistent and predictable.
Average Solar Generation
Parameter | Generation |
Daily Generation | 4,000-4,500 units/day |
Monthly Generation | 1.2-1.35 lakh units |
Annual Generation | 14-16 lakh units (kWh) |
These values are consistent with national averages of solar radiation and confirmed by industry data from large EPC companies.
Generation by Panel Type
Mono-PERC Modules
→ 14-15 lakh units/year
N-Type TOPCon Modules
→ 15-16 lakh units/year
(Higher bifacial gain + lower degradation)
Region-wise Differences
- Rajasthan, Gujarat, MP → Maximum production
- Tamil Nadu, Karnataka, Maharashtra → Strong and stable
- East/North-East India → Slightly lower due to cloud cover
Why Power Generation Matters
Generation dictates:
- Revenue (for developers)
- Savings (for C&I consumers)
- Payback period
- Long-term plant viability
Final Takeaway
A 1 MW solar power plant remains one of the most reliable long-term investments in India. With falling module prices, easier open access, and annually rising power tariffs, large consumers and developers can commit to 25 years of inexpensive electricity.
A 1 MW system produces up to 16 lakh units per annum, reduces huge operational expenses, and delivers a 4.5 to 6.5-year payback, outperforming most conventional industrial investments. Advancements in module efficiency, modern EPC practices, and robust monitoring have significantly improved plant performance and reliability.
Whether for captive industrial consumption, group captive, or third-party sale, a 1 MW project is a predictable, scalable, and decades-long asset for any business seeking predictable power prices and lower carbon footprint.